


Tuesday, 06 October 2009
Numbers, numbers...
This morning’s Indy Star has a front-page story covering the he-said she-said over the city’s animal control (a.k.a. “dog poundâ€) department.[1]
Two sidebars of statistics accompany the article. The first:
The first sidebar appears relatively straightforward, but the second contains an interesting example of how the way a statistic - here, animals returned to the shelter - is presented can affect the reader’s reaction. The 56% jump in the return rate sounds horrible (unsurprising for a number provided to bolster the mayor’s case against the fired director), but if we drill down a bit we discover that the “56% jump†represents 44 animals returned, out of 1,658 placed. Figuring backward, that means last year’s returned number (for the same period) was 28.
IMO, a more reasonable metric would be one that measured placement success. (Let’s call the successful ones “adoptions.â€) That is: What percentage of placements don’t work? So grab the calculator, and...
IOW, under the new regime, despite a 25% increase in animals placed, the rate of failures - animals that were returned, for whatever reason - only increased by a bit more than 1/2 of one percent. Or how about this:
So, despite a 25% increase in animals placed, the likelihood of any adoption being successful dropped only 1/2 of one percent, and remained above 97%. Not too shabby for an operation that doesn’t require extensive one-on-one interviews for prospective adopters.
’Sall in how you say it, innit? And, were I reporting this story, I would hope that my spidey-sense would be acute enough to spot the slant in that oh-so-attractive 56% number.
Here endeth today’s lesson in spinnery.
(BTW, I got the Star image from Newseum.org’s Today’s Front Pages, which, disconcertingly enough, hosts a clearer front-page image than the Star’s own Indystar.com site. Go figure.)
Elsewhere, piling on:
-----
Comments are disabled.
Post is locked.
This morning’s Indy Star has a front-page story covering the he-said she-said over the city’s animal control (a.k.a. “dog poundâ€) department.[1]
Two sidebars of statistics accompany the article. The first:
Animal controland...
City officials say the service suffered during the nine months Douglas Rae ran the Animal Care and Control division this year -- January through September -- compared with the same period last year.
» 7% more calls for service
» 41% fewer animals impounded
» 29:36:00 average response time this year, an increase of more than nine hours, from 20 hours, 7 minutes last year.
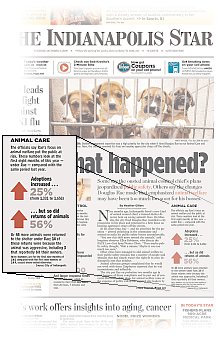
Animal careAs you can see from the image, the sidebars emphasized the percentages; the figures all came from the city.
The officials say Rae's focus on animal welfare put the public at risk. These numbers look at the first eight months of this year -- under Rae -- compared with the same period last year.
» 25% increase in adoptions, from 1,331 to 1,658
» 56% increase in returns of animals
» Or 44 more animals were returned to the shelter under Rae; 14 of those returns were because the animal was aggressive, including 3 that reportedly bit their owners.
The first sidebar appears relatively straightforward, but the second contains an interesting example of how the way a statistic - here, animals returned to the shelter - is presented can affect the reader’s reaction. The 56% jump in the return rate sounds horrible (unsurprising for a number provided to bolster the mayor’s case against the fired director), but if we drill down a bit we discover that the “56% jump†represents 44 animals returned, out of 1,658 placed. Figuring backward, that means last year’s returned number (for the same period) was 28.
IMO, a more reasonable metric would be one that measured placement success. (Let’s call the successful ones “adoptions.â€) That is: What percentage of placements don’t work? So grab the calculator, and...
2009 (8 months): 44 returns/1658 placements = failure rate of 2.65%
2008 (same period): 28 returns/1331 placements = failure rate of 2.10%
2008 (same period): 28 returns/1331 placements = failure rate of 2.10%
IOW, under the new regime, despite a 25% increase in animals placed, the rate of failures - animals that were returned, for whatever reason - only increased by a bit more than 1/2 of one percent. Or how about this:
2009 (8 months): (1658-44) adoptions/1658 placements = 97.3% success
2008 (same period): (1331-28) adoptions/1331 placements = 97.8% success
2008 (same period): (1331-28) adoptions/1331 placements = 97.8% success
So, despite a 25% increase in animals placed, the likelihood of any adoption being successful dropped only 1/2 of one percent, and remained above 97%. Not too shabby for an operation that doesn’t require extensive one-on-one interviews for prospective adopters.
’Sall in how you say it, innit? And, were I reporting this story, I would hope that my spidey-sense would be acute enough to spot the slant in that oh-so-attractive 56% number.
Here endeth today’s lesson in spinnery.
(BTW, I got the Star image from Newseum.org’s Today’s Front Pages, which, disconcertingly enough, hosts a clearer front-page image than the Star’s own Indystar.com site. Go figure.)
Elsewhere, piling on:
Are you listening Gannett? The only reason we are still subscribing to your local rag is to give the cat a place to pee, and you can’t even do that job right.
-----
[1] Long story short: Nine months after hiring an experienced shelter director who promised to shift the shelter’s emphasis toward adoption of unwanted animals, our mayor fired him (mostly on the stated grounds of “public safetyâ€- not enough strays picked up) and replaced him with a lawyer. Advance Indiana has some coverage here and here.
Posted by: Old Grouch in
The Press
at
17:58:55 GMT
| No Comments
| Add Comment
Post contains 593 words, total size 7 kb.
72kb generated in CPU 0.0658, elapsed 0.1224 seconds.
50 queries taking 0.1094 seconds, 182 records returned.
Powered by Minx 1.1.6c-pink.
50 queries taking 0.1094 seconds, 182 records returned.
Powered by Minx 1.1.6c-pink.


