Friday, 27 March 2009
Reporting the housing figures- hiding the bad news
Home sales “up†in February! Oh really?
Ritholz says it’s incompetence, not agenda, noting that
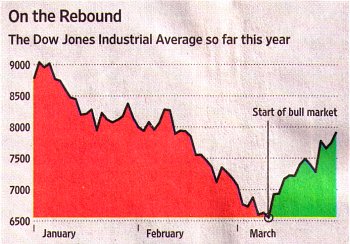
And then there’s this chart, from the front page[2] of today’s Wall Street Journal...

Pretty dramatic, huh? Except the chart starts with January, not with the market’s 2007 high of 14165.[3][4] Also note the label “Start of bull market.†Anybody ready to put some money on that? Safer to say: “Start of the present rally.â€
To be fair, the accompanying article (and its headline)[2] are more pessimistic (in paragraph 2):
Related: Changing the recession narrative? (Via: Instapundit)
Ritholz link from Howard.
-----
Comments are disabled.
Post is locked.
Home sales “up†in February! Oh really?
A parade of the mathematically innumerate business writers (and even worse headline writers!) continue to misread data. The latest evidence? New Home Sales....but that number falls within the Bureau’s margin of error of ±18.3%, which means there may have been no improvement at all.
After incorrectly reporting the Existing Home Sales, the mainstream media misread the Census department report of New Homes.
No, New Home Sales data did not improve. In fact, they were not only not positive, they were actually horrific. The year over year number was a terrible down 41%. Sales from this same period a year ago have nearly been halved.
Why did the media report this as positive? If you only read the headline number, you saw a positive datapoint: February was plus 4.7% over January... - Barry Ritholz[1]
Ritholz says it’s incompetence, not agenda, noting that
...many of these folks incorrectly misinformed you that Housing wasn’t getting worse in 2006, 2007 and 2008 — just as Home sales and prices went into an historic freefall.Still, it’s interesting that nobody seems to have gotten it right. What do they do, copy from each other?
And then there’s this chart, from the front page[2] of today’s Wall Street Journal...

Pretty dramatic, huh? Except the chart starts with January, not with the market’s 2007 high of 14165.[3][4] Also note the label “Start of bull market.†Anybody ready to put some money on that? Safer to say: “Start of the present rally.â€
To be fair, the accompanying article (and its headline)[2] are more pessimistic (in paragraph 2):
To many skeptical investors, it seems to be a Cinderella bull market, however: one that will turn out to be an illusion when the clock strikes midnight.and more accurate (in paragraph 5)
Still, the Dow remains down 44% from the high of 14164.52 it reached in 2007.But how many readers will just glance at the chart, and believe they’ve got the whole story?
Related: Changing the recession narrative? (Via: Instapundit)
Ritholz link from Howard.
-----
[1] Ritholz’ own headline also fails the accuracy test: “New home sales fell 41% in February, 2009†No they didn’t. They were 41% below (“fell from�) the February 2008 figure, but near steady (“the same as�) January 2009.
[2] “Bears Are Wary as Bull Returns • Dow is up 21% in 13 days in quickest rally since 1938, but doubts of strength persist†by E.S. Browning, The Wall Street Journal, March 27, 2009, page 1 [not found online]
[3] ...which would have put the top of the chart above the top of the page. (snark!)
[4] And what about that suppressed zero...? After all, stocks weren’t valueless on March 9th.
Posted by: Old Grouch in
The Press
at
16:30:58 GMT
| Comments (2)
| Add Comment
Post contains 447 words, total size 6 kb.
1
There's a reason the Ball State J-school requires a course called "Economics for Journalists." Most of the students were depressingly bad at it. (I was not one of them.)
Posted by: Joanna at 03/27/09 18:43:05 (ygqs7)
2
Figures don't lie, but liars figure. Facts and data can be massaged to show anything. There is such subjectivity in a lot of science that it's almost a faith-based system in itself. Used to be, put a guy in a black suit and Roman collar, and people accepted whatever he said. Now, put him in a white lab coat and have him hold a clipboard for the same effect.
Posted by: mts1 at 03/28/09 00:10:11 (RRkJh)
72kb generated in CPU 0.2594, elapsed 0.357 seconds.
52 queries taking 0.3226 seconds, 185 records returned.
Powered by Minx 1.1.6c-pink.
52 queries taking 0.3226 seconds, 185 records returned.
Powered by Minx 1.1.6c-pink.


